OUR LEARNING JOURNEY
Statistical Investigation - Teacher Guided
As a class we looked at completing a statistical investigation together. Through this we collected data on a tally chart and then transferred this data to a bar graph.
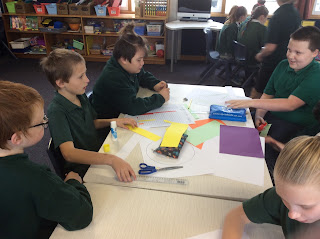
Then using a 100 bead line we calculated the percentage and made a pie graph. Children went away and followed the same process.
Finally children had to analyse their graphs and write a statement about them.
From here children took part in a group brainstorm about different areas they may like to investigate independently next.


No comments:
Post a Comment